Introduction
With the CAx - Container Availablity Index - you can get an overview of where there are surpluses and deficits in majors port. Let this help you make smarter repositioning and trading decisions.
You can find the CAx [here]. Remember to sign up for the bi-weekly newsletter to always stay up-to-date with the CAx.
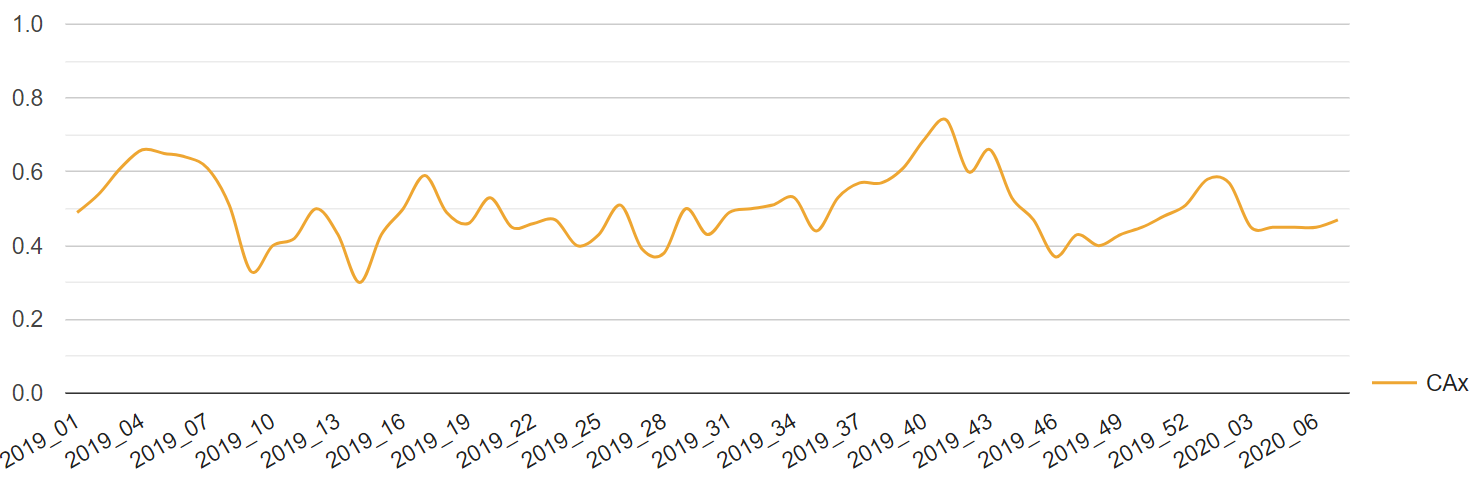
Weekly Availability
With the Weekly Availability, you can see the latest trends in container availability. Choose what time period you want to display, what location you want to know about and which equipment type you are looking for. There are currently 12 locations available and 3 equipment type with more coming shortly.
The graph shows the current availability with 0.5 as balanced, meaning there are as many containers available as is needed to have balance in the market. With a number higher than 0.5 means that there are more containers available than what the market asks for. A number lower than 0.5 means that there are not enough containers available.
xChange forecasts the availability for 3 weeks into the future, helping you get an idea of what is to come. These forecasts are based on 3 different xChange data points:
- Requirements
- Balances
- Container moves
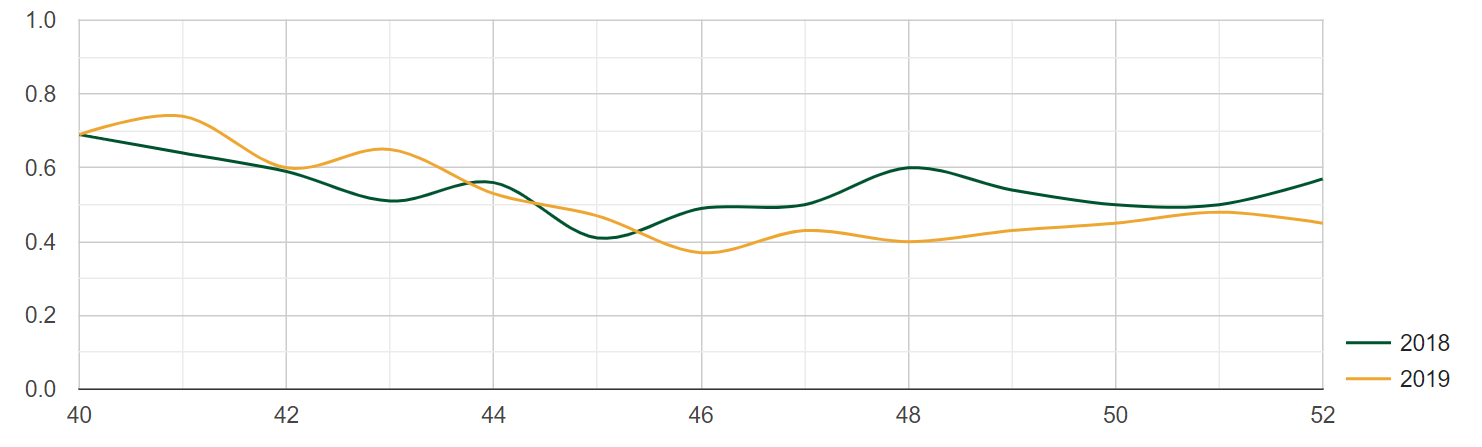
Year on year availability
The Year on Tear Availability allows you to get an insight into the years prior and presents availability. See trends in the markets year by year to help you forecast the coming year.
Comments
0 commentsPlease sign in to leave a comment.